

Why Source From India: Strengths, Limits and the Evidence
- Updated
The decision in brief is in the playbook: Why India, and when not → /india/#why-india
In March 2026 someone posted on an Indian business forum with a family problem. Their father makes metal handicrafts in one of India's craft towns, the kind of brass and metal ware you'll find in homeware shops from Sydney to London. The products "are made on order so they are not mass produced", scaling "means getting in touch with more exporters", and "Particularly the last five years have been very hard on him" (r/IndiaBusiness, March 2026 (opens in a new tab)). A reply said it's a very common situation in hubs like Moradabad and Jaipur.
We keep coming back to that post, because it holds the honest case for India in a few lines. There's real skill, there's spare capacity and there's a maker who would give a steady buyer full attention. There's also no scale, no marketing and no easy way for you to find him. This page sets out where India is genuinely strong, where it isn't, and the bigger economic story that makes it worth building here rather than just buying. Every claim has a source. The ones we couldn't source are at the end, and we tell you why we won't repeat them.
1. Cotton: Second, Not First
Nearly every India sourcing guide we read calls India the world's largest cotton producer. The USDA doesn't. Its April 2026 outlook puts China at 35.8 million bales for 2025/26 and India at 23.8 million, about a fifth of world output (USDA ERS Cotton and Wool Outlook, 13 April 2026 (opens in a new tab)). India's crop is down for a third year, its mills use 25.5 million bales, more than it grows, and imports rose 38% to 4.2 million bales (same source).
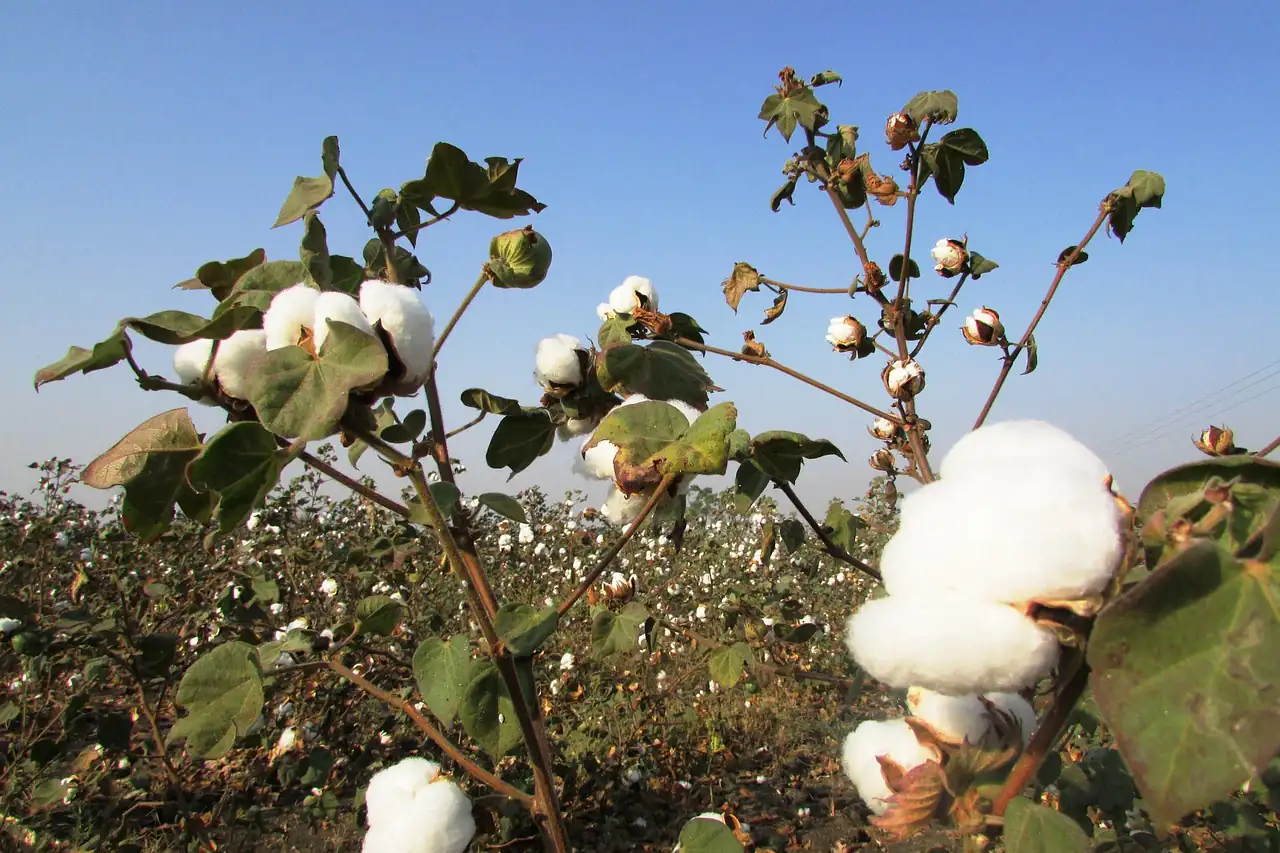
The myth has an origin. A USDA chart from the mid-2010s showed India briefly ahead of China (USDA ERS chart (opens in a new tab)), and the line has been copied ever since. So what does it mean for you? India has cotton, cotton mills and cotton skills. It doesn't have a cotton surplus, so a mill's yarn price tracks the world price, and a supplier who promises "our own cheap cotton" is telling you a story.
2. Organic Cotton And Certification
Here the case is strong. By our calculation from Textile Exchange's crop data, India grew about 62% of the world's certified organic cotton in 2023/24, 436,648 tonnes out of about 706,000 (Textile Exchange Materials Market Report 2025 (opens in a new tab)), and Textile Exchange itself says "the majority". India also holds 27.8% of the world's 17,800 GOTS-certified facilities, against China's 17.3%, Türkiye's 11.7%, Bangladesh's 9.3% and Viet Nam's 0.9% (GOTS Annual Report 2025 (opens in a new tab), as of 1 January 2026). Bangladesh and Viet Nam import their cotton.
Say it fairly though. The evidence supports "certified fibre", and it doesn't show India ahead on labour compliance. The ILO's Better Work programme runs in Bangladesh and Viet Nam and not in India (Better Work (opens in a new tab), country list read 25 September 2026). If your brand's promise is organic then India is the natural home. If it's audited labour conditions then you'll build that yourself, factory by factory, and certificates don't do it for you. How to check them at the source is in Checking suppliers.
3. Clusters, Craft And The Things Nobody Else Makes
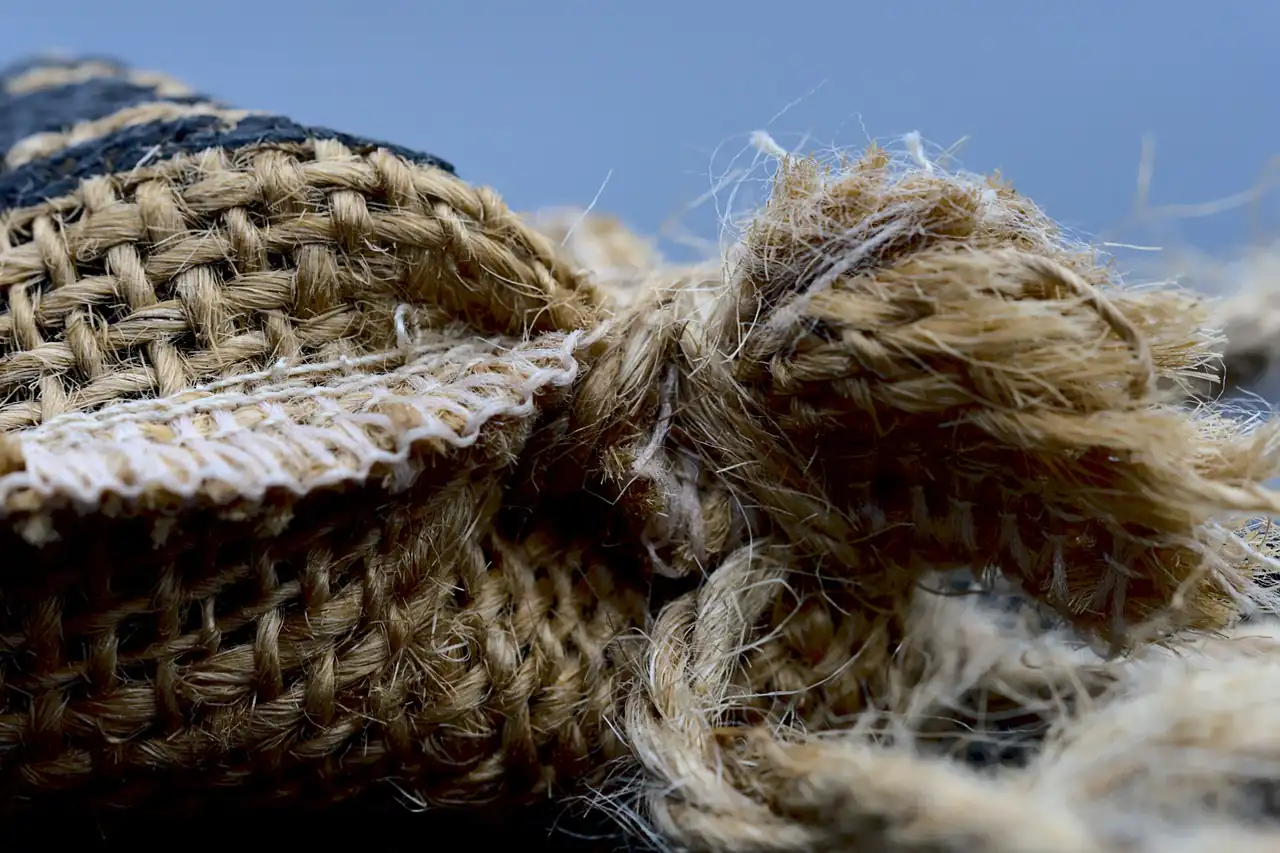
Jute is the overlooked one. India supplies 57.4% of the UK's imports of sacks and packing bags (HS 6305, US$91.0 m) and 45.5% of the US's (US$361.4 m) (sourced from official data: UN Comtrade (opens in a new tab), 2025). For promotional bags and agricultural sacks there's no second country with that depth.
The bigger strength is the cluster itself. The DGFT names 42 towns for export excellence (Appendix 1B (opens in a new tab)), and what matters isn't the label but what sits under it. In these towns the dyeing, the stitching, the trims and the finishing are a few kilometres apart, and a supplier's neighbour is often its subcontractor. That's exactly what a small order needs, and it's also why the metal-ware maker in our opening story makes to order for exporters rather than selling direct. Ask who makes each step. Which town for which product is in Where production sits.
Tiles are the quiet gainer. India was the EU's largest outside supplier of ceramic tiles in 2025 at 38.4%, ahead of Türkiye, and #3 in the UK at 17.9% (UN Comtrade, 2025). That's Morbi in Gujarat, and it's still under most buyers' radar.
4. Engineering: India's Biggest Export Group
Engineering goods reached US$122.43 bn in FY2025-26, 27.71% of merchandise exports and an all-time high for the second year running (EEPC India analysis for March 2026 (opens in a new tab), from DGCI&S data). Look at where India ranks among each market's suppliers in 2025 and a pattern jumps out (sourced from official data: UN Comtrade). India is the #1 supplier of iron and steel castings to the US (42.8%) and #2 to the EU (21.0%). It's #2 in seamless steel tubes into Australia (24.9%), #3 in gears and transmission parts into the US (11.5%) and a top-four supplier to the EU of gears, bearings, tubes and generating sets.
The industry behind those numbers is mostly small. India is the world's second-largest castings producer, 15.86 million tonnes from about 5,000 units, 90% of them MSMEs (Institute of Indian Foundrymen via The Machine Maker, February 2026 (opens in a new tab) · Reported). Airbus sources over US$1.6 bn a year of components and services from India (Airbus in India (opens in a new tab), read 25 September 2026).

Now the point that matters more than any rank. Machined parts and castings draw the most buyer complaints on forums (five voices, 2021 to 2025 · Indicative), and they're the same categories where India ranks #1 to #4. Both are true. The share is carried by audited, export-grade makers who work to drawing and hold their tolerances, and the complaints come from small workshops that took a job they hadn't tooled for. Decide the tier you need before you search. Telling an audited exporter from a small job shop takes checks on the ground, and SourcingSync (opens in a new tab) does that.
5. Electronics: The China+1 Case That Worked
Smartphones were India's top single export in 2025 at US$30.13 bn (PIB, 11 March 2026 (opens in a new tab)). Smartphone exports went from ₹1,500 crore in FY2014-15 to ₹2,00,000 crore in FY2024-25 (PIB explainer (opens in a new tab)), and India supplied 42.3% of US smartphone imports in 2025, up from US$74 m of shipments in 2019 (UN Comtrade, 2025).
That's a real success, and it's a big-factory story. The domestic value added in phones is still low, 18 to 20% by the industry body's 2026 estimate, with about 60% of inputs imported (ICEA via Business Today, 2026 (opens in a new tab) · Reported), and India's share of chip and computer imports into your markets is 0.3% or less. Buy the assembled product, not the components.
6. Where India Is Weaker
Apparel share hasn't moved. India held 3.2% of world apparel exports in 2010 and 3.0% in 2025, while Bangladesh and Viet Nam together went from about 7% to over 13% (The Tribune (opens in a new tab) · Reported). The mix underneath is shifting though. Woven apparel is gaining share in the UK (5.6% to 7.3%) and the US (5.7% to 7.7%) while knitwear loses ground in the EU (UN Comtrade, 2019 to 2025). Read that as a signal about what to buy, not whether to buy.
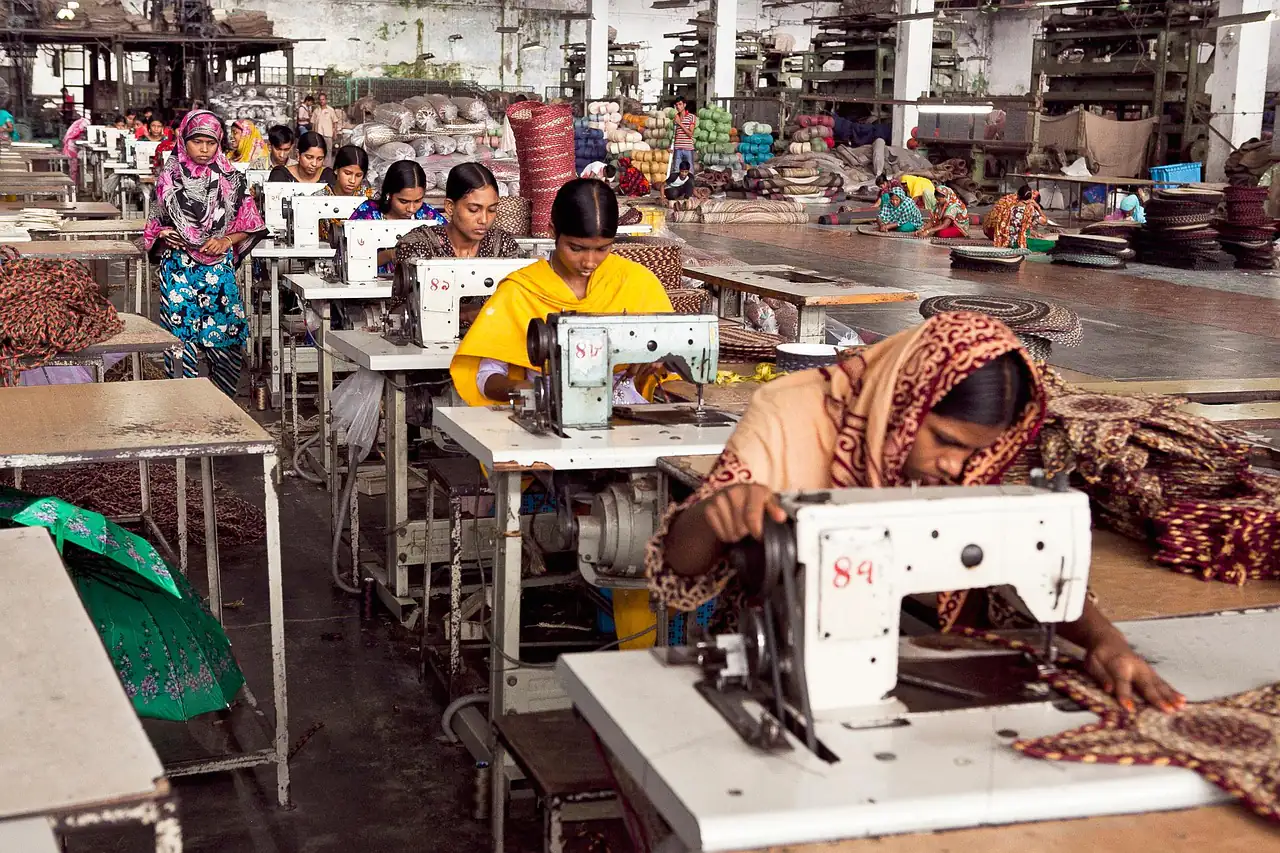
Factories are small and synthetics are thin. The average Indian apparel factory employs 131 people, export units 600 to 800 (The Tribune, as above). Primark's disclosed Bangladeshi factories average about 3,230 workers against about 620 in the Tiruppur area (Primark Global Sourcing Map (opens in a new tab), November 2025, counts only). India's man-made-fibre export line is US$4.83 bn against US$11.59 bn for cotton (PIB annexure (opens in a new tab)), so polyester-led fast fashion has a thin base.
The finance gaps are structural. ICRIER's study of why Bangladesh and Viet Nam pulled ahead names back-to-back letters of credit, bonded warehouses, FDI-led industrial parks and trade agreements (ICRIER (opens in a new tab) · Reported). The trade agreements changed in 2026 for buyers in Australia, the UK and soon New Zealand. The finance side hasn't, and you'll meet it the first time a small supplier asks for a big advance.
Small orders aren't cheaper. Below a few hundred units, UK importers on forums say to buy simple items locally (four voices, 2016 to 2026 · Indicative, one (opens in a new tab), another (opens in a new tab)). Add freight, duty where it still applies and your own time, and the gap closes.
Concentration cuts both ways. The US and EU together take about 49.2% of India's textile and apparel exports (PIB, Ministry of Textiles, December 2025 (opens in a new tab)), and when US tariffs jumped in 2025 Tiruppur exporters were told to absorb the cost or lose the orders (Business & Human Rights Resource Centre (opens in a new tab) · Reported). For a buyer in Australia, the UK or the Gulf that's bargaining power, because a supplier whose US orders are shaky wants you. It's also something to check, since a factory that just lost a big account may be short of cash.
7. A Poor Country That's Growing Fast
This is the part most sourcing guides skip, and we think it's the best long-term reason to be here.
India is still a poor country. Its income per person was US$2,760 in 2025 on the World Bank's Atlas measure, which classes it as lower-middle income (World Bank, GNI per capita (opens in a new tab)). That's a little below Bangladesh (US$2,840), a bit over half of Viet Nam (US$4,970) and about a fifth of China (US$14,230). It's also a country that has moved a long way in a short time, and the figures show it. Income per person was US$1,540 in 2014, so it has nearly doubled in eleven years (same series). The economy grew 7.2% in 2023, 7.1% in 2024 and 7.6% in 2025 (World Bank, GDP growth (opens in a new tab)). And the share of Indians below the World Bank's extreme poverty line, now US$3.00 a day, fell from 27.1% in 2011 to 5.3% in 2022 (World Bank, poverty headcount (opens in a new tab)).
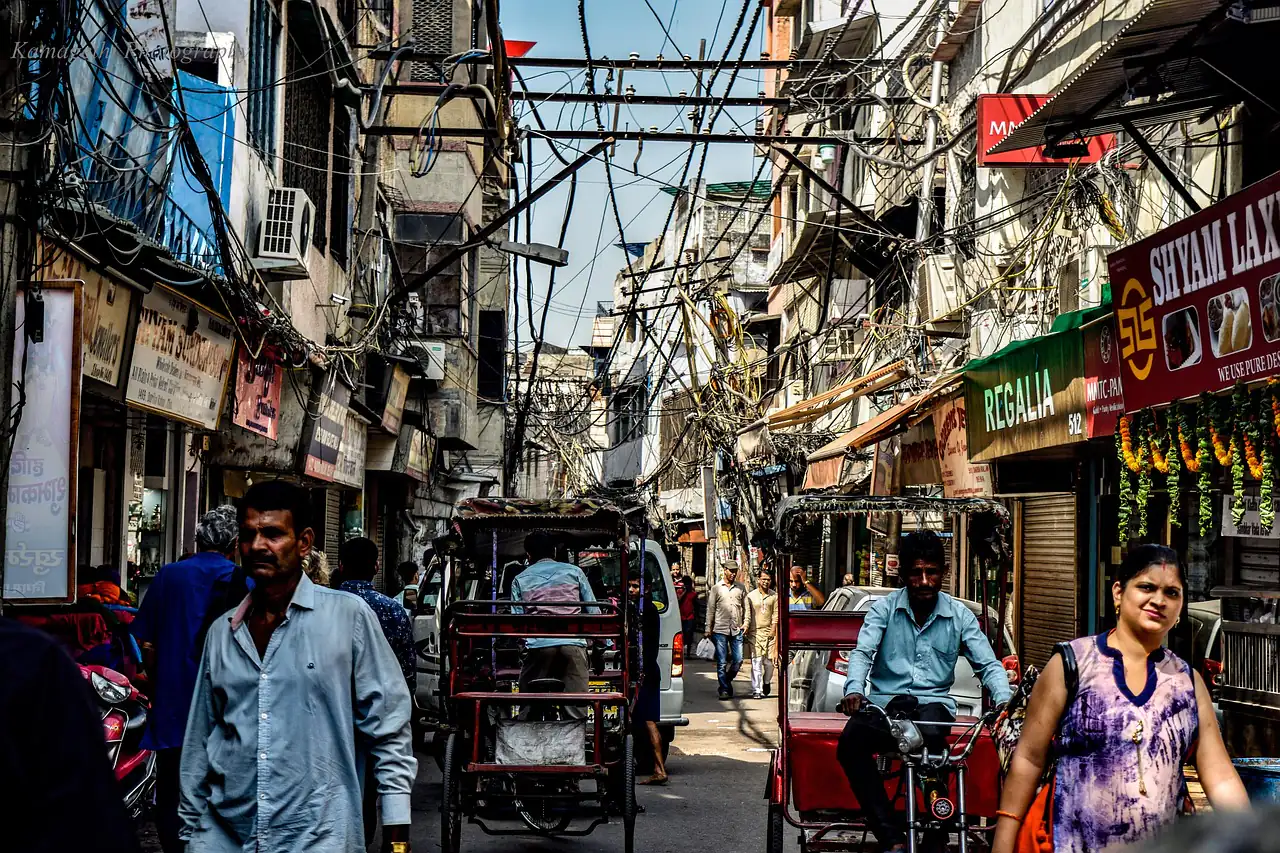
The manufacturing push is real, and so far it's unfinished. Make in India launched in September 2014 with a goal of lifting manufacturing to 25% of the economy (Down To Earth, 2024 (opens in a new tab) · Reported). In the World Bank's series manufacturing was 15.1% of GDP in 2014 and 13.5% in 2025 (World Bank, manufacturing value added (opens in a new tab)). India's own national accounts measure it differently and put it higher, but no measure gets near 25%, and the government has since set a new National Manufacturing Mission with the goal pushed out to 2035 (reported by IMPRI (opens in a new tab) · Reported). Phones took off. Most of the rest is still workshops.
So why should a buyer care? Not out of sympathy - you're running a business, and so is your supplier. It matters for three plain commercial reasons.
First, a growing economy with low incomes means capable people who want steady work, and small makers like the one in our opening story who'll put a regular buyer at the front of the queue. Second, the ground is moving. Trade deals with Australia, the UK and New Zealand arrived in the space of a year, infrastructure scores are rising, and a maker who ships your first 500 pieces today may be able to ship 5,000 in five years. Buyers who are already inside that relationship get the capacity first. Third, rising incomes also mean rising costs over time, so India won't stay a low-cost story forever, and it shouldn't be your only reason to come.
Our view is simple. Treat India as a place to build a supplier over years, not a place to shop for one order. Pay fairly and on time, help the maker understand your market's rules and grow together.
8. Who You're Really Competing With
India's share and its main rival's, by category, importer-recorded, 2025 (sourced from official data: UN Comtrade, Eurostat). EU figures count extra-EU imports only.
| Category | Market | India's share | Main rival |
|---|---|---|---|
| Bed, table and bath linen | UK / EU | 11.5% / 10.1% | Pakistan, 53.6% / 48.8% |
| Rugs and carpets | US | 38.0% | Türkiye, 22.8% |
| Footwear | EU | 4.7%, down from 6.2% in 2019 | Viet Nam 36.1%, China 26.1% |
| Ceramic tiles | EU | 38.4% (#1) | Türkiye, 35.5% |
| Sacks and packing bags | UK / US | 57.4% / 45.5% | China 14.5% / Mexico 13.1% |
| Babies' knitted garments | UK / US / AU | 25.4% / 23.2% / 20.9% | Bangladesh (UK), Viet Nam (US), China (AU) |
| Cotton T-shirts | EU / UK / US | 6.9 to 8.0% | Bangladesh, on price |
And the T-shirt price itself, customs value per piece in 2025 (Eurostat Comext (opens in a new tab), HMRC (opens in a new tab), UN Comtrade (opens in a new tab) · Verified arithmetic):
| Market | India | Bangladesh | Viet Nam | India vs Bangladesh |
|---|---|---|---|---|
| EU (€) | 2.22 | 1.83 | 4.41 | +21% |
| UK (£) | 2.14 | 1.68 | 3.75 | +27% |
| US ($) | 1.83 | 1.63 | 2.61 | +12% |
| Australia ($) | 2.29 | 2.64 | 4.31 | −13% |
| New Zealand ($) | 2.81 | 2.66 | 4.36 | +6% |
Two caveats before you wave this at a supplier. Unit values mix products, because a plain tee and a printed organic tee share one customs code, so these are benchmarks and never quotes. And customs values exclude duty. Bangladesh enters the EU duty-free and keeps that at least until the end of 2029 (European Commission, Q&A on the new GSP (opens in a new tab)), while the India-EU deal isn't in force yet. Australia is the exception worth noticing, since India undercuts Bangladesh there and ECTA makes it duty-free. The duty side for each market is on the EU page, the UK page and the Australia page.
9. Claims We Won't Repeat, And Why
You'll read these elsewhere. "India is the world's largest cotton producer" - it's second, per the USDA figures above. "Labour is 20 to 30% cheaper than China" - a competitor's claim we couldn't trace to any source. "Quality is more variable than China" - no measured comparison exists. "English is an advantage" - maybe, but nobody has shown it changes outcomes. Lead-time and wage comparisons - no published measurement. "ECTA boosted India's share in Australia" - the non-fuel share went from 1.93% to 1.97% between 2022 and 2025 (ABS (opens in a new tab)). And "India is weak in precision engineering" - India ranks #1 to #4 in castings, gears, tubes and bearings. The weakness is supplier tier, and upstream in machine tools and chips.
10. Fit By Buyer Type
An ecommerce brand with revenue. India fits when your product carries a story a customer will pay for, such as organic cotton, a hand process or a named material. It fits less well when you compete on being the cheapest plain thing on the page. Your risk is the domestic-first factory that hasn't exported before, so check it.
A wholesaler, importer or distributor. India fits for volume in rugs, jute packaging, tiles, castings and gears, where it holds a top-three share in at least one of your markets. Compare landed cost against Pakistan, Türkiye or Viet Nam for the same spec, never unit price. Your risk is a supplier that lives on one US account.
A product entrepreneur. India fits if you can reach a few hundred units and your product sits in a cluster. Below that, buy from stock, prove the demand and come back.
We never learned whether the metal-ware maker found his buyers. The thread doesn't say. But his situation is the one this page keeps landing on - skill without scale, in a country that's getting richer year by year. If your product fits and you're willing to build, that's a supplier worth finding, and the rest of this playbook shows you how.
Next: if India fits, the next question is what to buy. What you can source from India →